We designed Esya, a Level Four automated car, which will utilize a variety of non-traditional interfaces, including impoverished, speech, gesture, and haptic interfaces to interact with its users.
I will show only the VUI design for different systems, but you are welcome to read the full report here
My Contributions
This is my final project for non-traditional interfaces class. I’m responsible for designing the entertainment system and coordinating the overall speech interface functions across three systems (entertainment, operation, and environment).
Relevant Skills: Speech Interface Design, Mind Map, User Need Analysis
Need analysis
We define five important functions that should be achieved by entertainment system:
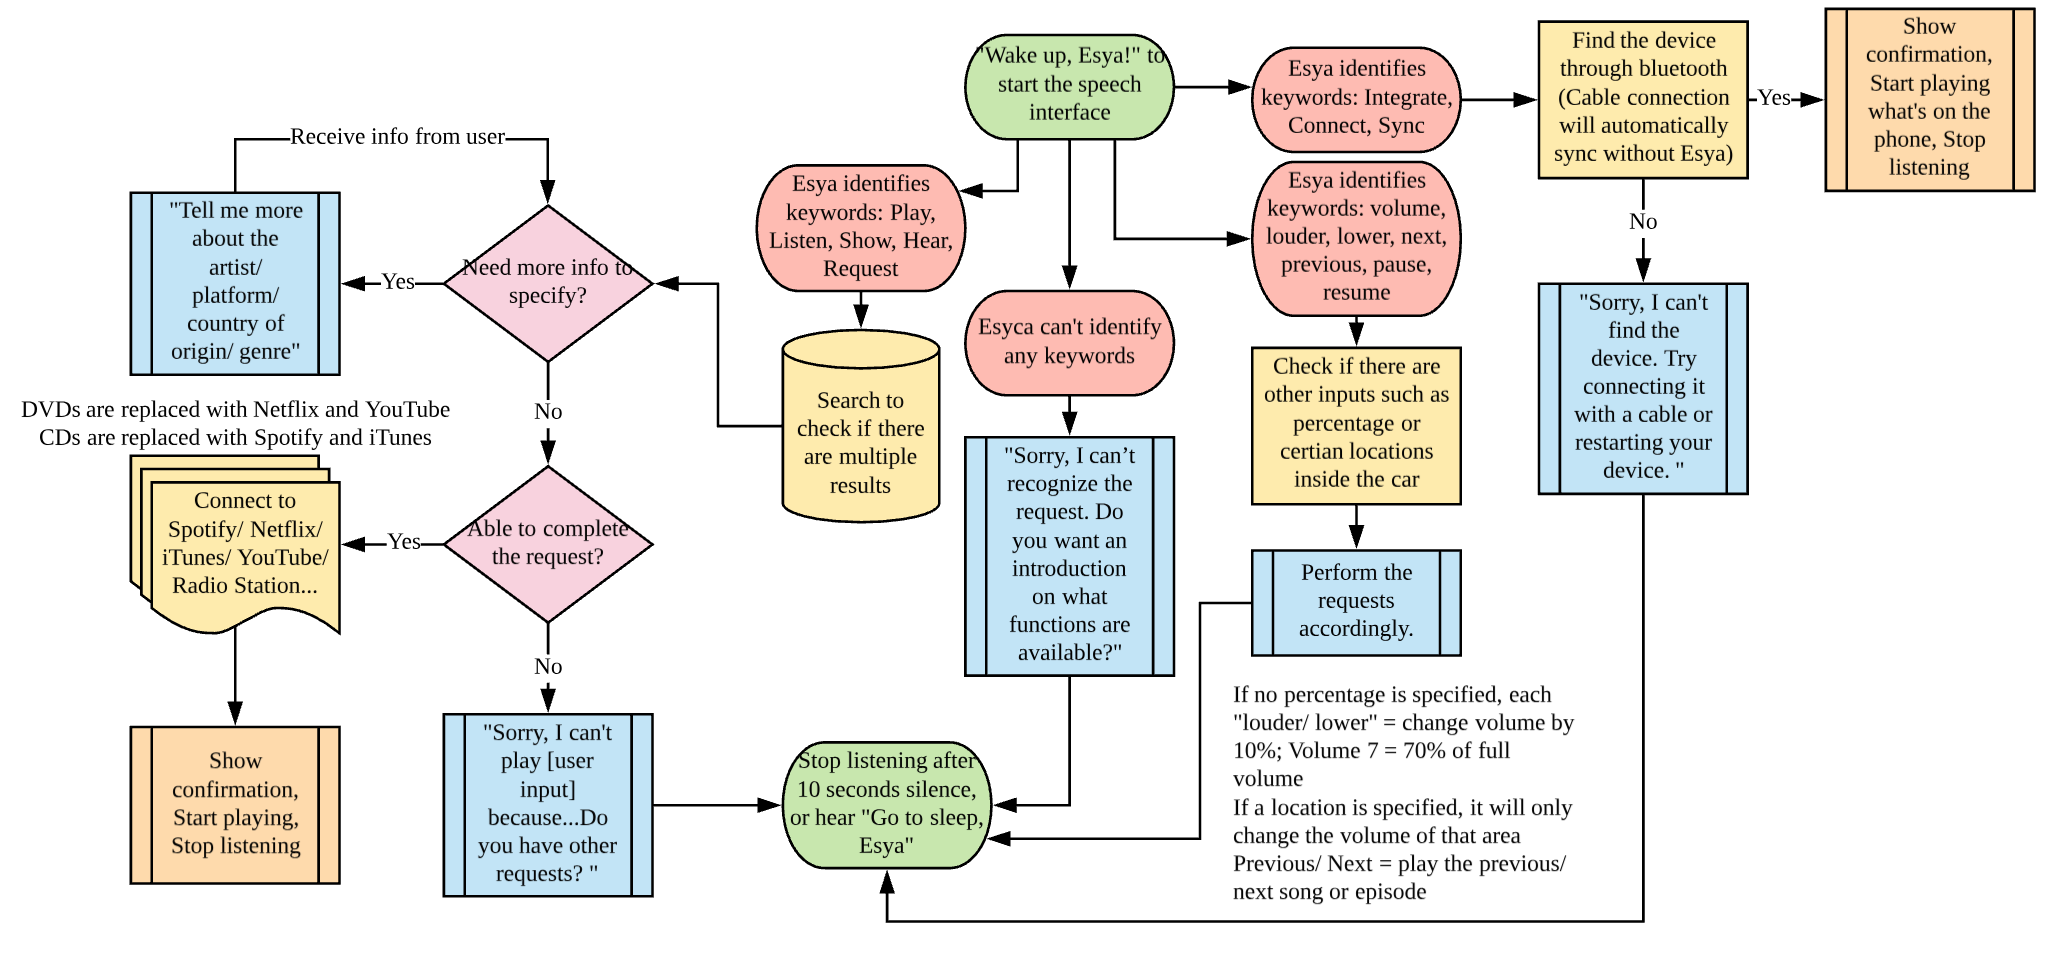
Play music, podcasts, radios, and other soundtracks when requested by the user
Show movies, TV shows and other videos when requested by the user
Perform advanced search, such as find a relaxing music playlist or display movies that are good for families
Operate on the ongoing task, such as adjust volume, pause, replay, show lyrics
Display the information of surrounding areas such as nearby restaurants, tourist attractions or gas stations when requested by the user
Users can perform those functions through the following ways.
Operate on the phone
Based on operational system, Esya will automatically connects to a phone at the initial setup. The user can operate on the phone directly. The music will be played through car stereo, and videos will be projected by AR to side windows.
To disconnect the phone, the user can either turn off the bluetooth or ask Esya to do so.
Talk to Esya
Here is a flow chart of the speech interface for entertainment system.
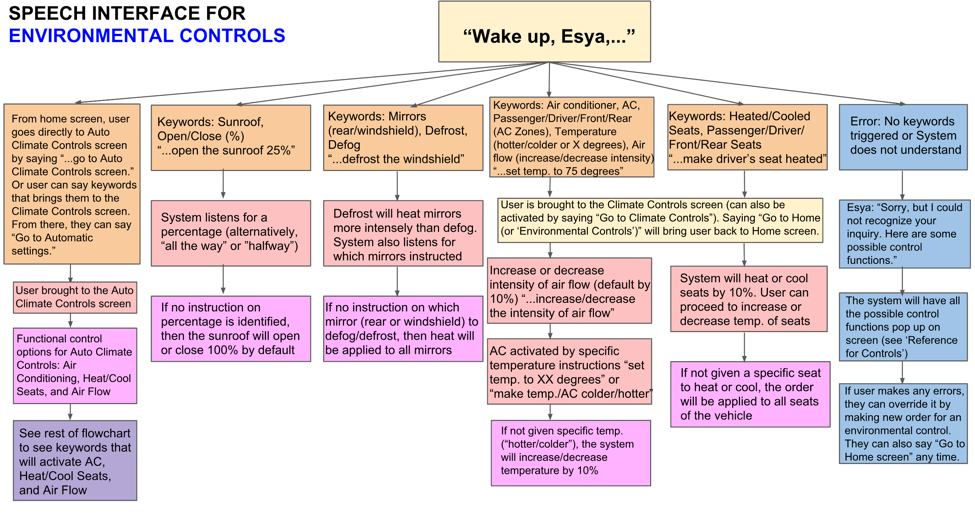
Here is the flow chart for environmental system:
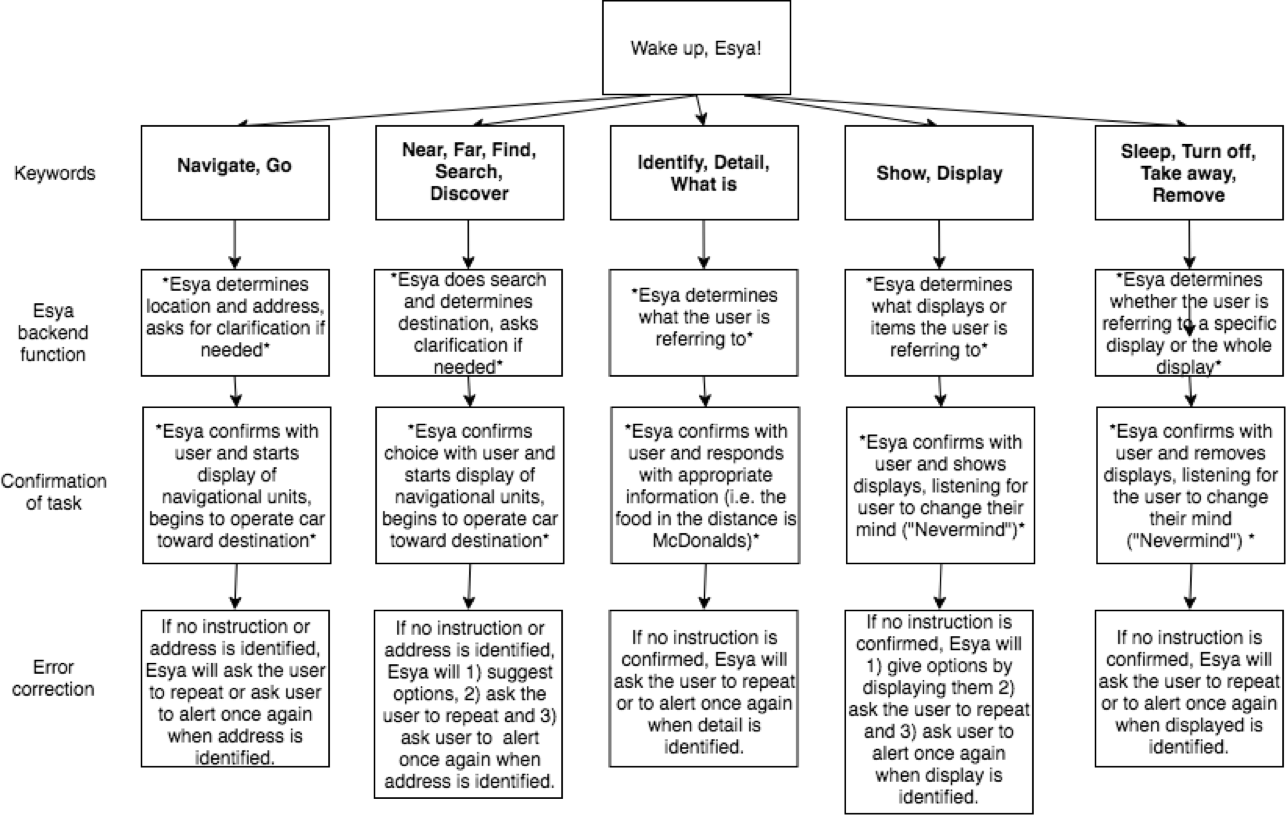
Here is the flow chart for navigation system:
Discussion
Why speech interface for entertainment system?
We use speech interface process the majority of tasks because:
Speech is a natural form of interaction, and Esya’s speaking voice is socially relatable, so it will contribute to user experience
Car is a private environment and noise level can be controlled
Good for passengers whose abilities to use their hands or eyes are limited
Relatively mature technology (e.g. Alexa, Google Home, Siri)
Potential issues with speech interface:
Only one person can talk when Esya is on, otherwise it may bring confusions
To turn on Esya again, the user needs to be as loud as the music playing
Eye-Tracking Study for Voting System
Research Design, Eye-Tracking Study, Data Analysis
Project Overview
In the case of ballots, there have been many famous cases of poorly-designed ballots leading to voter errors substantial enough to change the outcome of an entire election. This is likely due to subtle features of the ballot design interacting poorly with unanticipated voter strategies.
To better understand people’s use of two alternative memory strategies, retrieval-based VS. recognition-based, we used eye-tracking techniques to examine the the way voters sought information on the display.
We present evidence that voters in a mock election do, in fact, use both retrieval-and recognition-based strategies to cast votes, sometimes alternating between them. We then discuss the importance of considering these alternate cognitive strategies when designing user interfaces.
This project was published as a Human Factors and Ergonomics Society (HFES) conference paper.
My Contributions
I worked at Byrne lab as a research assistant for a year. For the fall semester, I worked on eye tracking data analysis from 16 subjects using the voting system on a computer. The goal of the analysis is to investigate which areas of the voting system interface (e.g. party, candidate, race) the subjects would fixate at, its frequency and time length, so that we can better understand where people pay attention to.
For the spring semester, I built a paper ballot interface for eye-tracking studies and ran 20 user studies independently. The goal of the paper ballot interface is to build something similar to real life voting scenario to collect data on which area (race, party, candidate name) the subjects would fixate at, so that we can understand their voting strategies and compare the results with those of multi-race ballot that I analyzed previously.
Video showing a subject's eye-tracking process when filling out a ballot
Eye-tracking Data Analysis
Fixation script
After cleaning and adding necessary columns on Excel, I wrote functions on Python to achieve the following:
decide whether the fixation is on the screen
Calculate the distance of the fixation and each object in the screen, find the closest object, and record the distance
Calculate the direction of the object and the fixation, both on X-axis and Y-axis
Add these variables to the original data frame to create a new Excel file
Fixation analysis
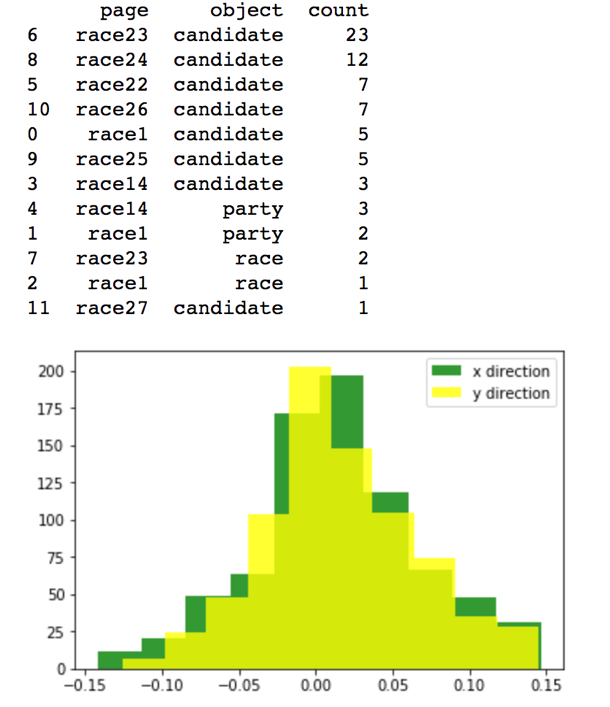
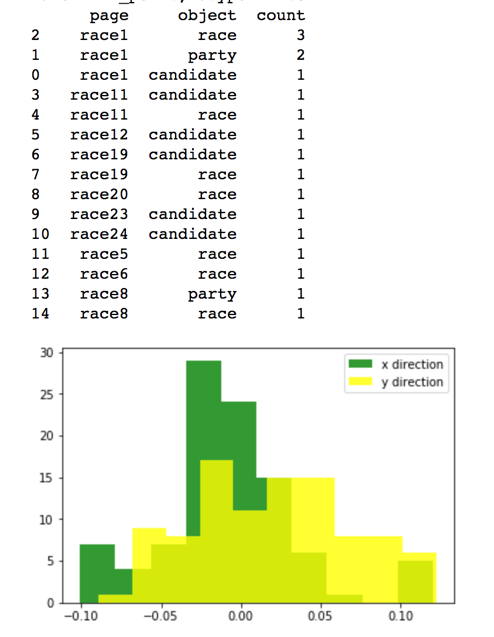
I first need to identify if there are any data skewed by eye tracker issues (e.g. constantly off the screen by a certain distance). So I plot the distribution of distance and direction for each subject, which ended up removing the data of subject 7 because of the low number of fixations.
Afterwards, to understand the fixation pattern of subjects, I wrote functions to 1) count the number of fixations for each race and 2) count the number of fixation on party, race, and candidate for each race and subject.
Based on the tables generated, most subjects fixated at the review page/ instruction page/ race 1 the most, and the fixations on subject 22-27 are also relatively large.
Furthermore, subjects paid attention to different information when using the voting system. For instance, subject 12 looked at candidate name the most, then party, then race, while subject 6 looked at race the most, then party, then candidate.
Fixation analysis output for subject 14
Fixation analysis output for subject 7, which I deleted because of tracker issues
Perception of Facebook Profiles
Literature Review, Research Design, Data Analysis
Project Overview
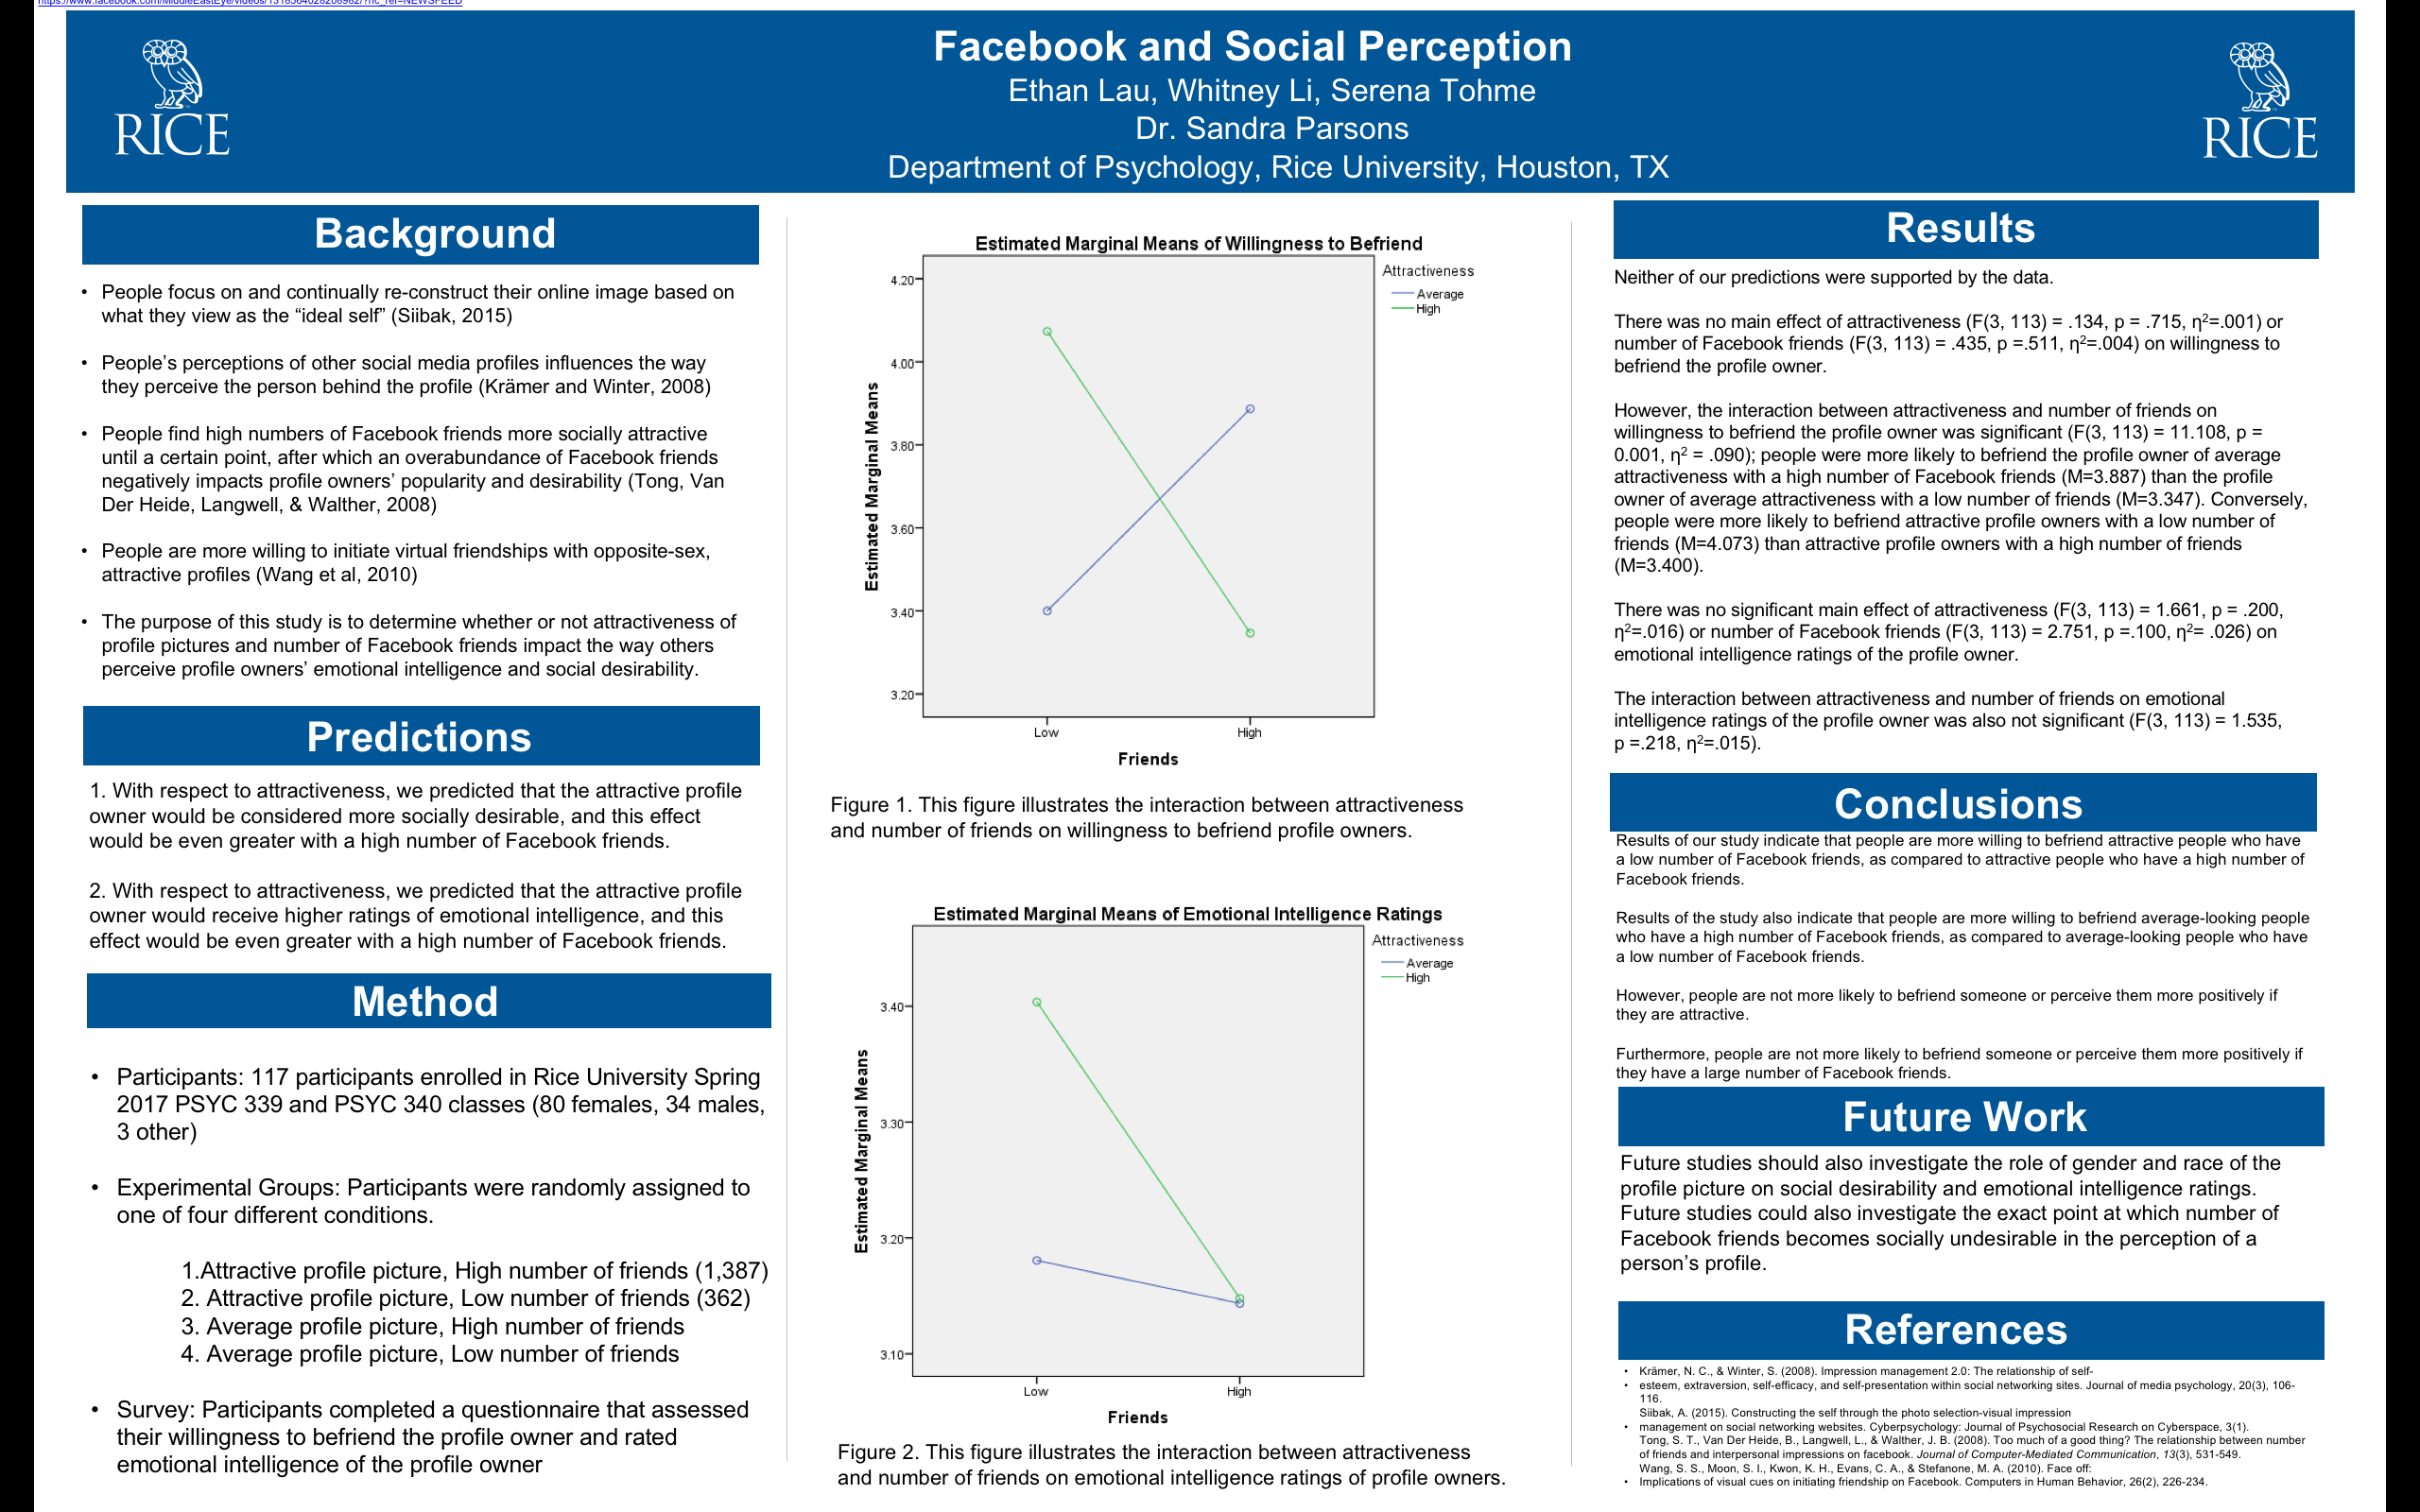
The purpose of this study is to determine whether or not attractiveness of profile pictures and number of Facebook friends impact the way others perceive profile owners’ emotional intelligence and social desirability.
My Contributions
I conducted literature review, designed experiment (including setting up the fake Facebook profiles), obtained IRB approval, recruited participants, coded data, analyzed results, created a poster and wrote a paper.
Hypotheses
With respect to attractiveness, we predicted that the attractive profile owner would be considered more socially desirable, and this effect would be even greater with a high number of Facebook friends.
With respect to attractiveness, we predicted that the attractive profile owner would receive higher ratings of emotional intelligence, and this effect would be even greater with a high number of Facebook friends.
Method
Participants: 117 participants enrolled in Rice University Spring 2017 PSYC 339 and PSYC 340 classes (80 females, 34 males, 3 other)
Experimental Groups: Participants were randomly assigned to one of four different conditions.
1. Attractive profile picture, High number of friends (1,387)
2. Attractive profile picture, Low number of friends (362)
3. Average profile picture, High number of friends
4. Average profile picture, Low number of friends
Survey: Participants completed a questionnaire that assessed their willingness to befriend the profile owner and rated emotional intelligence of the profile owner