Bill.comLicense PlateSong Records

Bill.Com Fraud Detection

Data Cleaning, Machine Learning
Project Overview
This is the senior capstone project for my statistics major. A five-student team worked with our client Bill.com, a company processing 120,000+ payment requests daily.

The goal of our project is to use over 250,000 transactions provided by Bill.com to find key features and patterns indicative of fraudulent transactions to build an effective model predicting fraudulent activities.
Project Impact
After cleaning, EDA, feature engineering and modeling, we found that XG boost with SMOTE oversampled data is the best model, reaching 95% success rate while being able to flag a minimal number of legitimate transactions as fraud.

As a result, the model saves 73.5 hours of manual checking daily and will be put into practice 2019 summer.
Final Poster for Fraud Detection

Predict Shanghai License Plate Price

Time-Series Analysis
Project Overview
This is an independent project for my time series analysis class, completed in my junior year.

Background
Shanghai uses an auction system to sell a limited number of license plates to fossil-fuel car buyers every month. The average price of this license plate is about $13,000 (the unit in original data is CNY) and it is often referred to as “the most expensive piece of metal in the world.” Getting plates outside Shanghai is a less appealing option, because the city doesn’t allow vehicles registered elsewhere on its elevated highways during rush hours.
My Approach
I first plotted the original time series of license average price and success rate. Because both ACF and PACF of average price show exponential decay and are not significant after 1, I first tried ARMA (1,1), and forecasted for the next 10 months.

For success rate, I conducted periodgram analysis and found the predominant cycle of 12. Based on ACF and PACF plots, I tried several SARIMA and garch models, and found SARIMA(1,0,0)(1,0,0)[12] the best fit.

Problem Statement

Giving the increasing average price for license plates and decreasing success rate, I want to build a relatively accurate forecast model for average plate price. The key questions for this work include:

  • What are the forecast, and forecast error bounds, for Shanghai average license plate price?
  • Based only on 2002-2013 data, how does our prediction for successful application rate differ from the reality?

  • forecast for the next 10 months with ARMA(1,1)
    periodogram analysis on past success rate

    Analysis

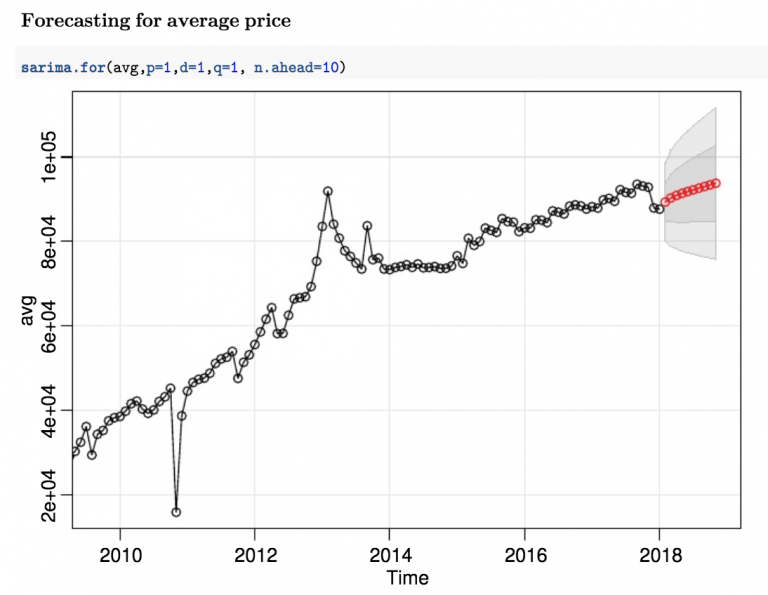
    The average price of Shanghai license plate is well captured by a low order ARIMA model, namely a ARIMA(1,1,1). Comparing the forecast with the actual average price for March and April 2018, the model did a good job.

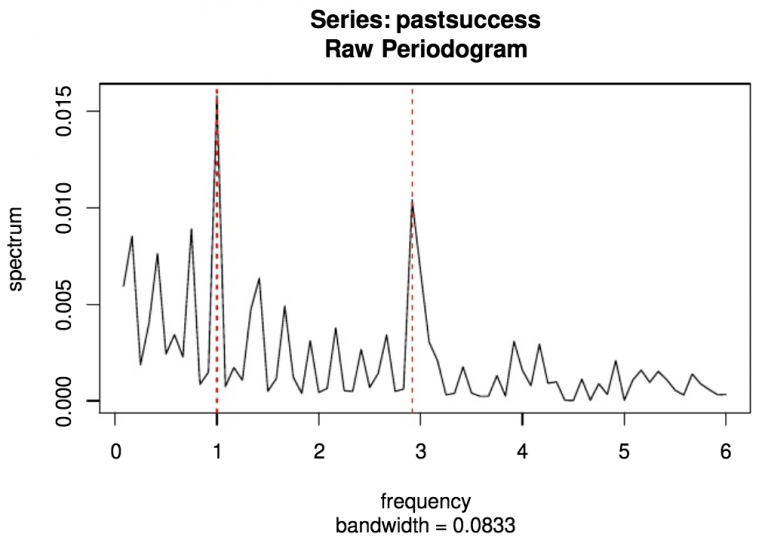
    The successful application rate of Shanghai license plate is well captured by a low order seasonal ARMA model, namely a SARIMA(1,0,0)x(1,0,0)[12].

    Forecasts predict the near term behavior of the series. The longterm forecasts converge to the estimated mean of the process, as expected. However, the seasonal model for successful application rate failed to see a sharp drop in 2014, which is caused by a sudden increase in the total number of applicants (the denominator for the success rate).

    The reason for the increasing applicants is unclear, but we need to be mindful about the impact of future events (or people’s expectations) instead of just focusing on the past data when we build model.
    You can read the full report (with my code and graphs) here

    Predict Popularity of Songs

    Machine Learning
    Project Overview
    The music industry has a well-developed market with a global annual revenue around $15 billion. The recording industry is highly competitive and is dominated by three big production companies which make up nearly 82% of the total annual album sales. Unfortunately, the success of an artist’s release is highly uncertain: a single may be extremely popular, resulting in widespread radio play and digital downloads, while another single may turn out quite unpopular, and therefore unprofitable.

    Knowing the competitive nature of the recording industry, record labels face the fundamental decision problem of which musical releases to support to maximize their financial success. How can we use analytics to predict the popularity of a song? In this project, I will predict whether a song will reach a spot in the Top 10 of the Billboard Hot 100 Chart.
    Dataset Info
    This is an independent, two-week project for data science tools and algorithms class in my senior year of college.

    Taking an analytics approach, I aim to use information about a song’s properties to predict its popularity. The dataset songs.csv consists of all songs which made it to the Top 10 of the Billboard Hot 100 Chart from 1990-2010 plus a sample of additional songs that didn’t make the Top 10. This data comes from three sources: Wikipedia, Billboard.com, and EchoNest.

    The variables included in the dataset either describe the artist or the song, or they are associ- ated with the following song attributes: time signature, loudness, key, pitch, tempo, and timbre.

    Conclusion

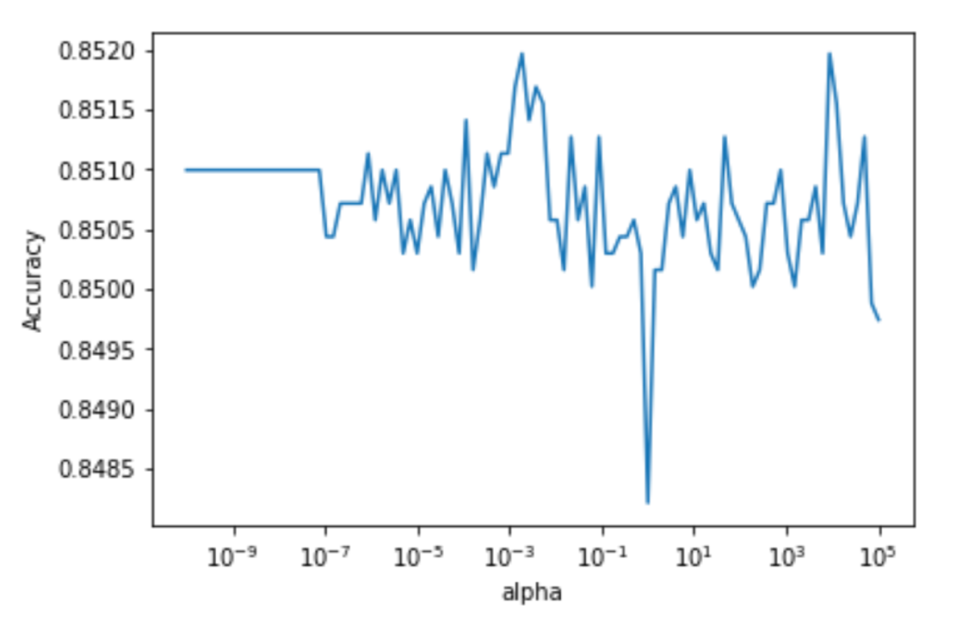
    I built three models. The first models is a logistic regression model with all variables. After checking the multi-collinearity, I built the second model using all the variables except loudness, and the third model using all the variables except energy.

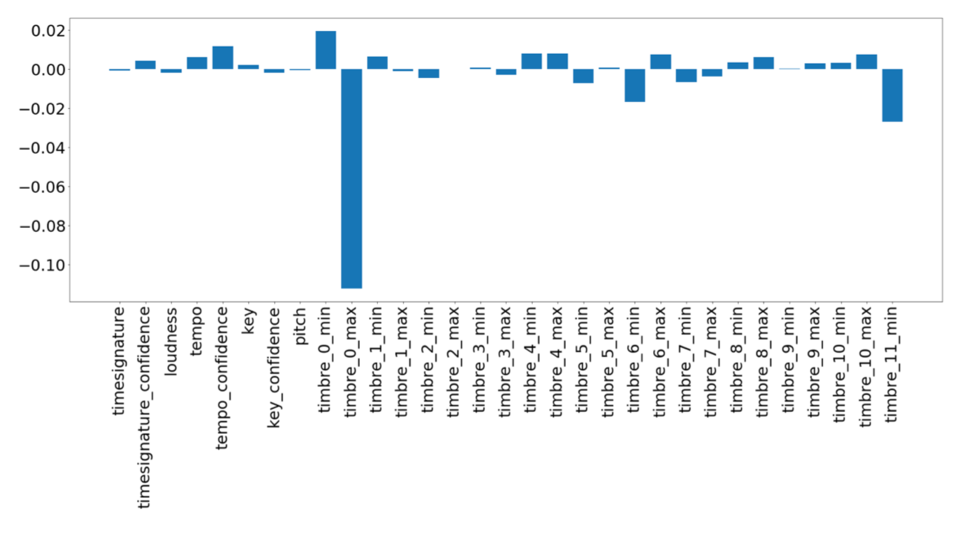
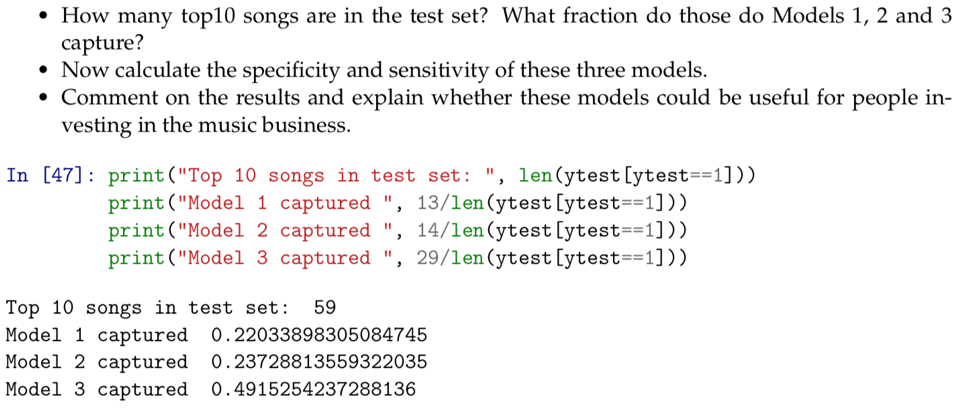
    Model 3 had the best performance by predicting 287 Not Top10 songs and 29 Top10 songs correctly using a threshold of 0.45. Furthermore, by plotting the coefficient significance, we found the top 2 predictors for record success are timbre_0_max and timbre_11_min, while coefficients of variables such as loudness and energy are close to 0, meaning that heavy instrumentation is not a significant factor in the mainstream taste.

    Find the best alpha to use in the model
    Analyze the importance of variables by visualizing the coefficients

    Model Result Comparison